New imaging technologies have increased our capabilities to resolve 3-dimensional structures from microscopic samples. Laser-scanning confocal microscopy is particularly amenable to this task because it allows the researcher to optically section biological samples creating 3-dimensional image volumes. However, a number of problems arise when studying neural tissue samples. These include data set size, physical scanning restrictions, volume registration and display. To deal with these issues, we undertook large-scale confocal scanning microscopy in order to visualize neural networks spanning multiple tissue sections. We demonstrate a technique to create and visualize a 3-dimensional digital reconstruction of the hypothalamic Arginine vasopressin magnocellular neuroendocrine system in the male mouse. The generated 3d data included a volume of tissue that measures 4.35 mm x 2.6mm x 1.4 mm with a voxel resolution of 1.2 microns. The dataset matrix included 3508x2072x700 pixels and was a composite of 19600 optical sections. Once reconstructed into a single volume, the data is suitable for interactive stereoscopic projection. Stereoscopic imaging provides greater insight and understanding of spatial relationships in neural tissues' inherently three dimensional structure. This technique provides a model approach for the development of data sets that can provide new and informative volume rendered views of hypothalamic structures. This study affirms the value of stereoscopic volume based visualization in neuroscience research/education, and the feasibility of creating large scale high resolution interactive 3d reconstructions of neural tissue from microscopic imagery.
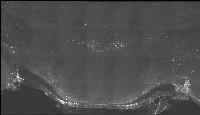
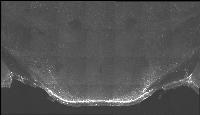
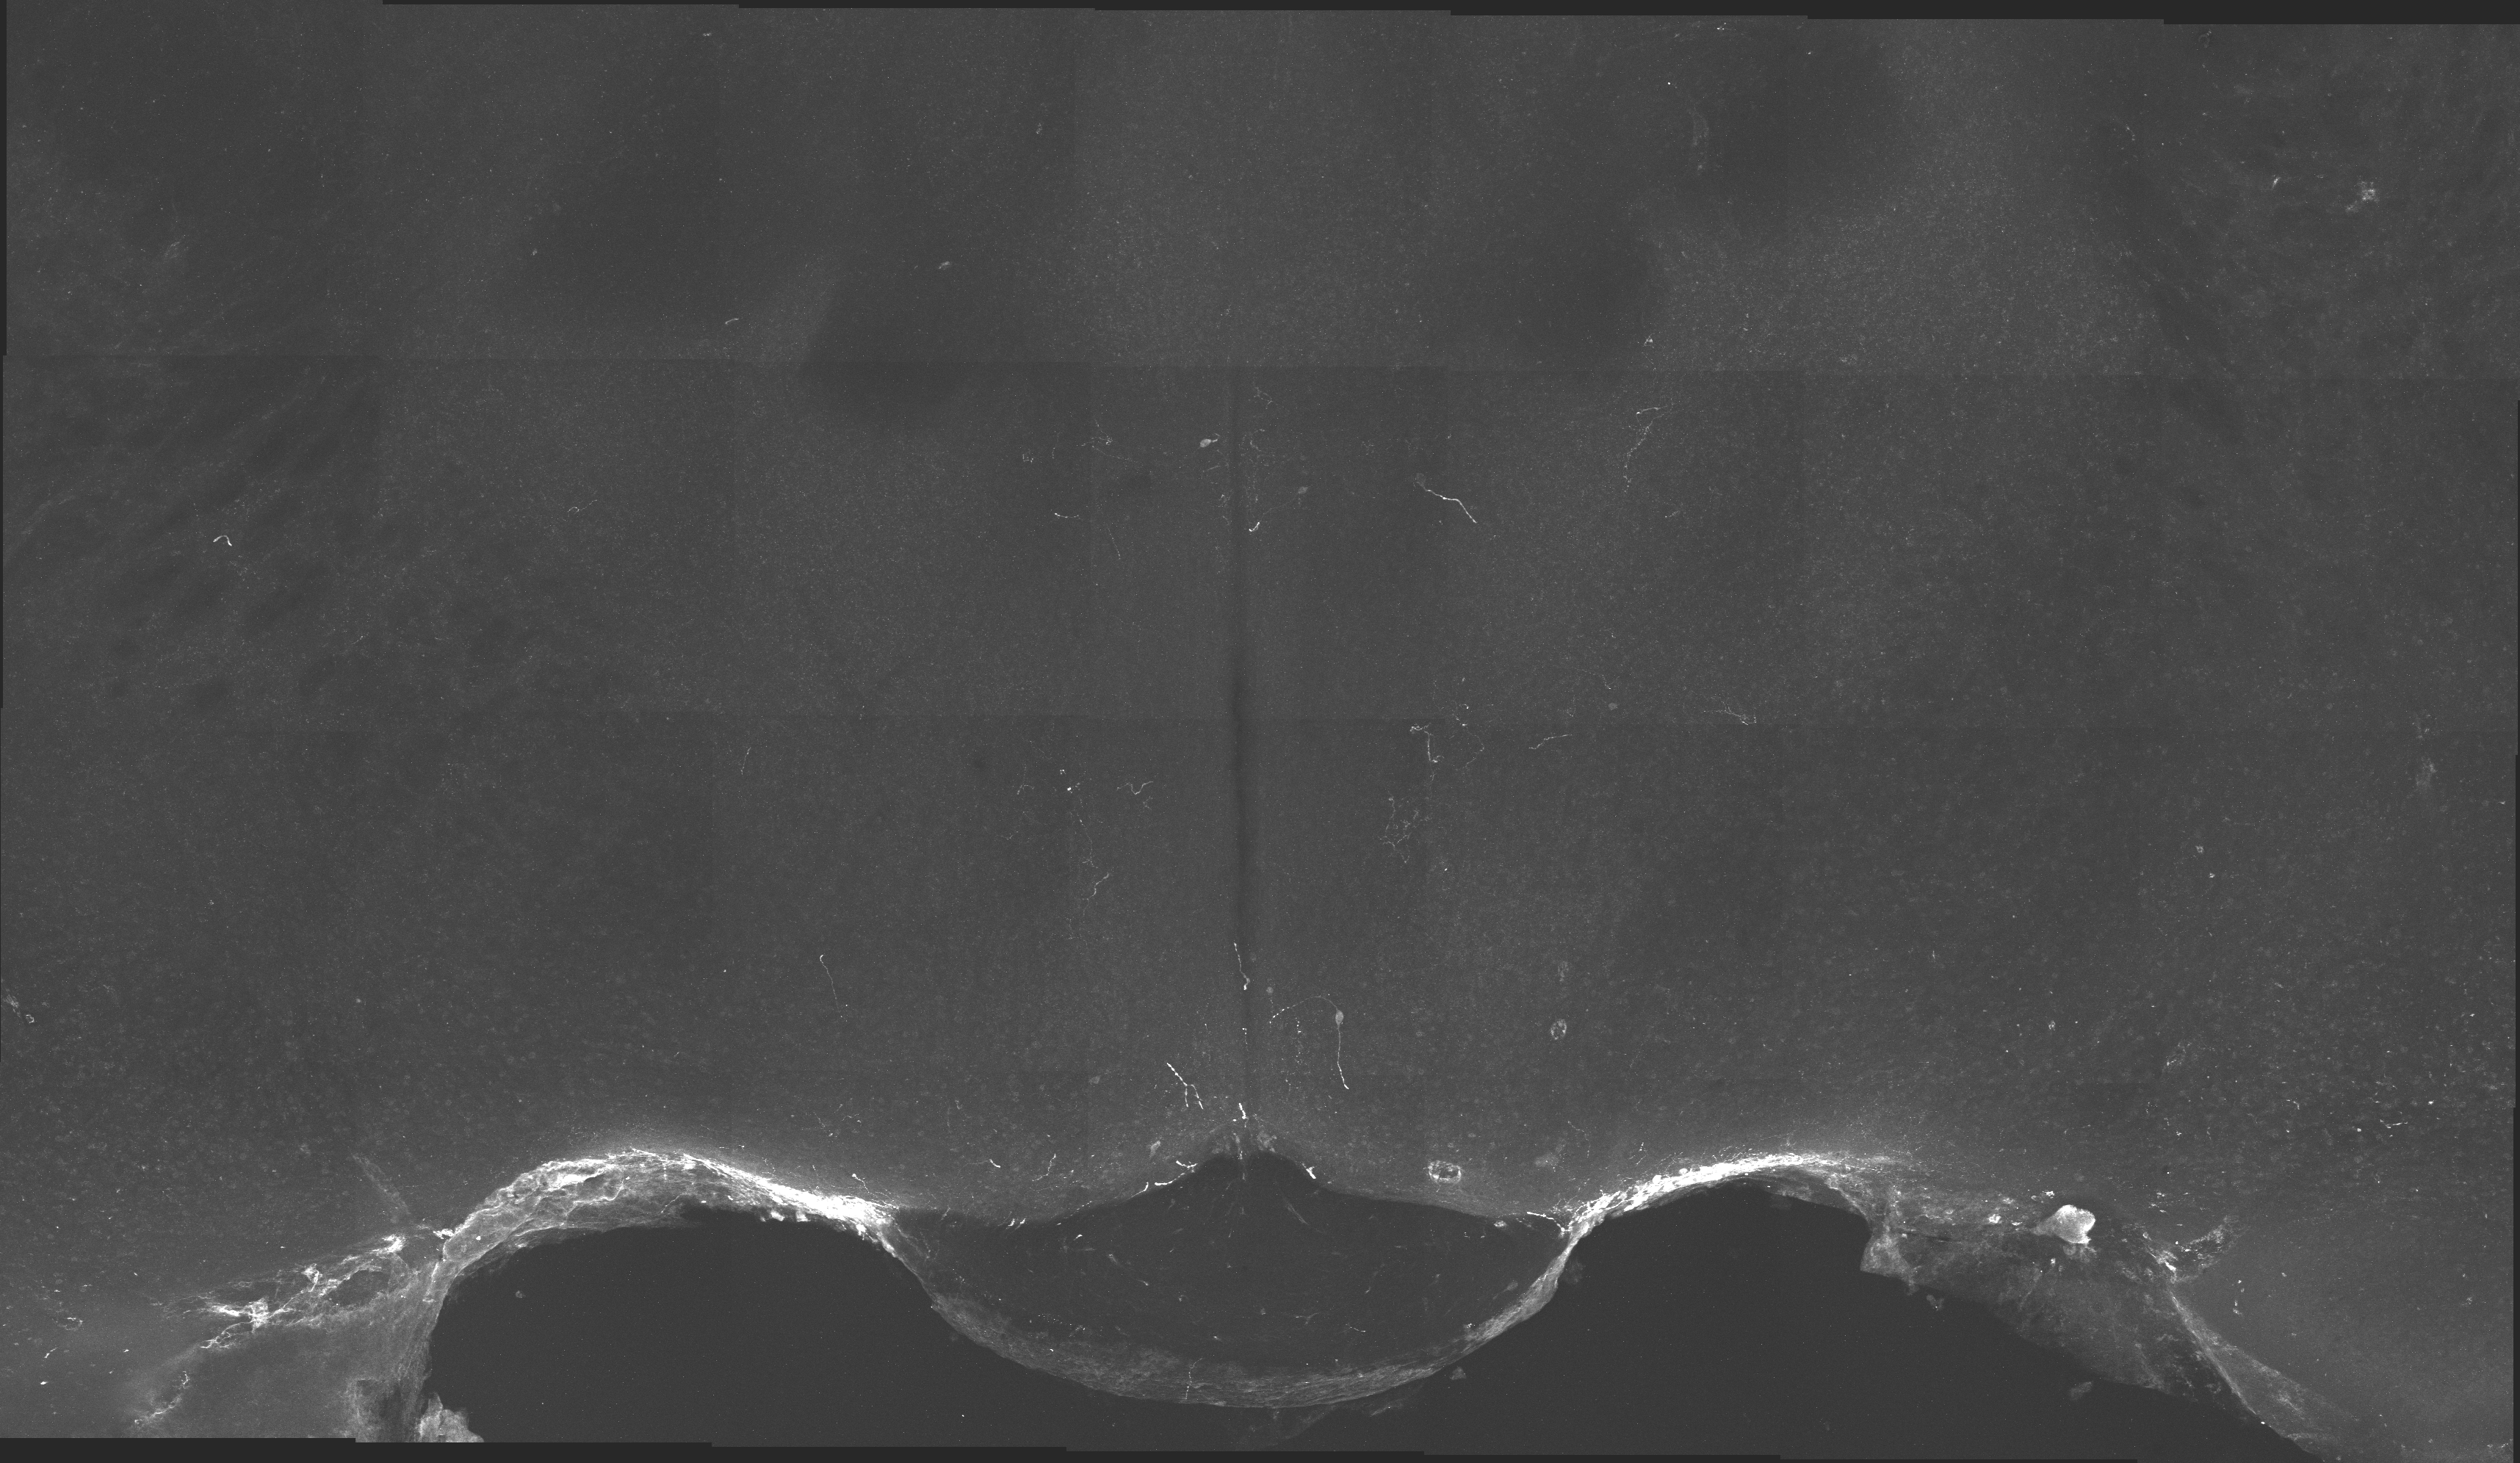
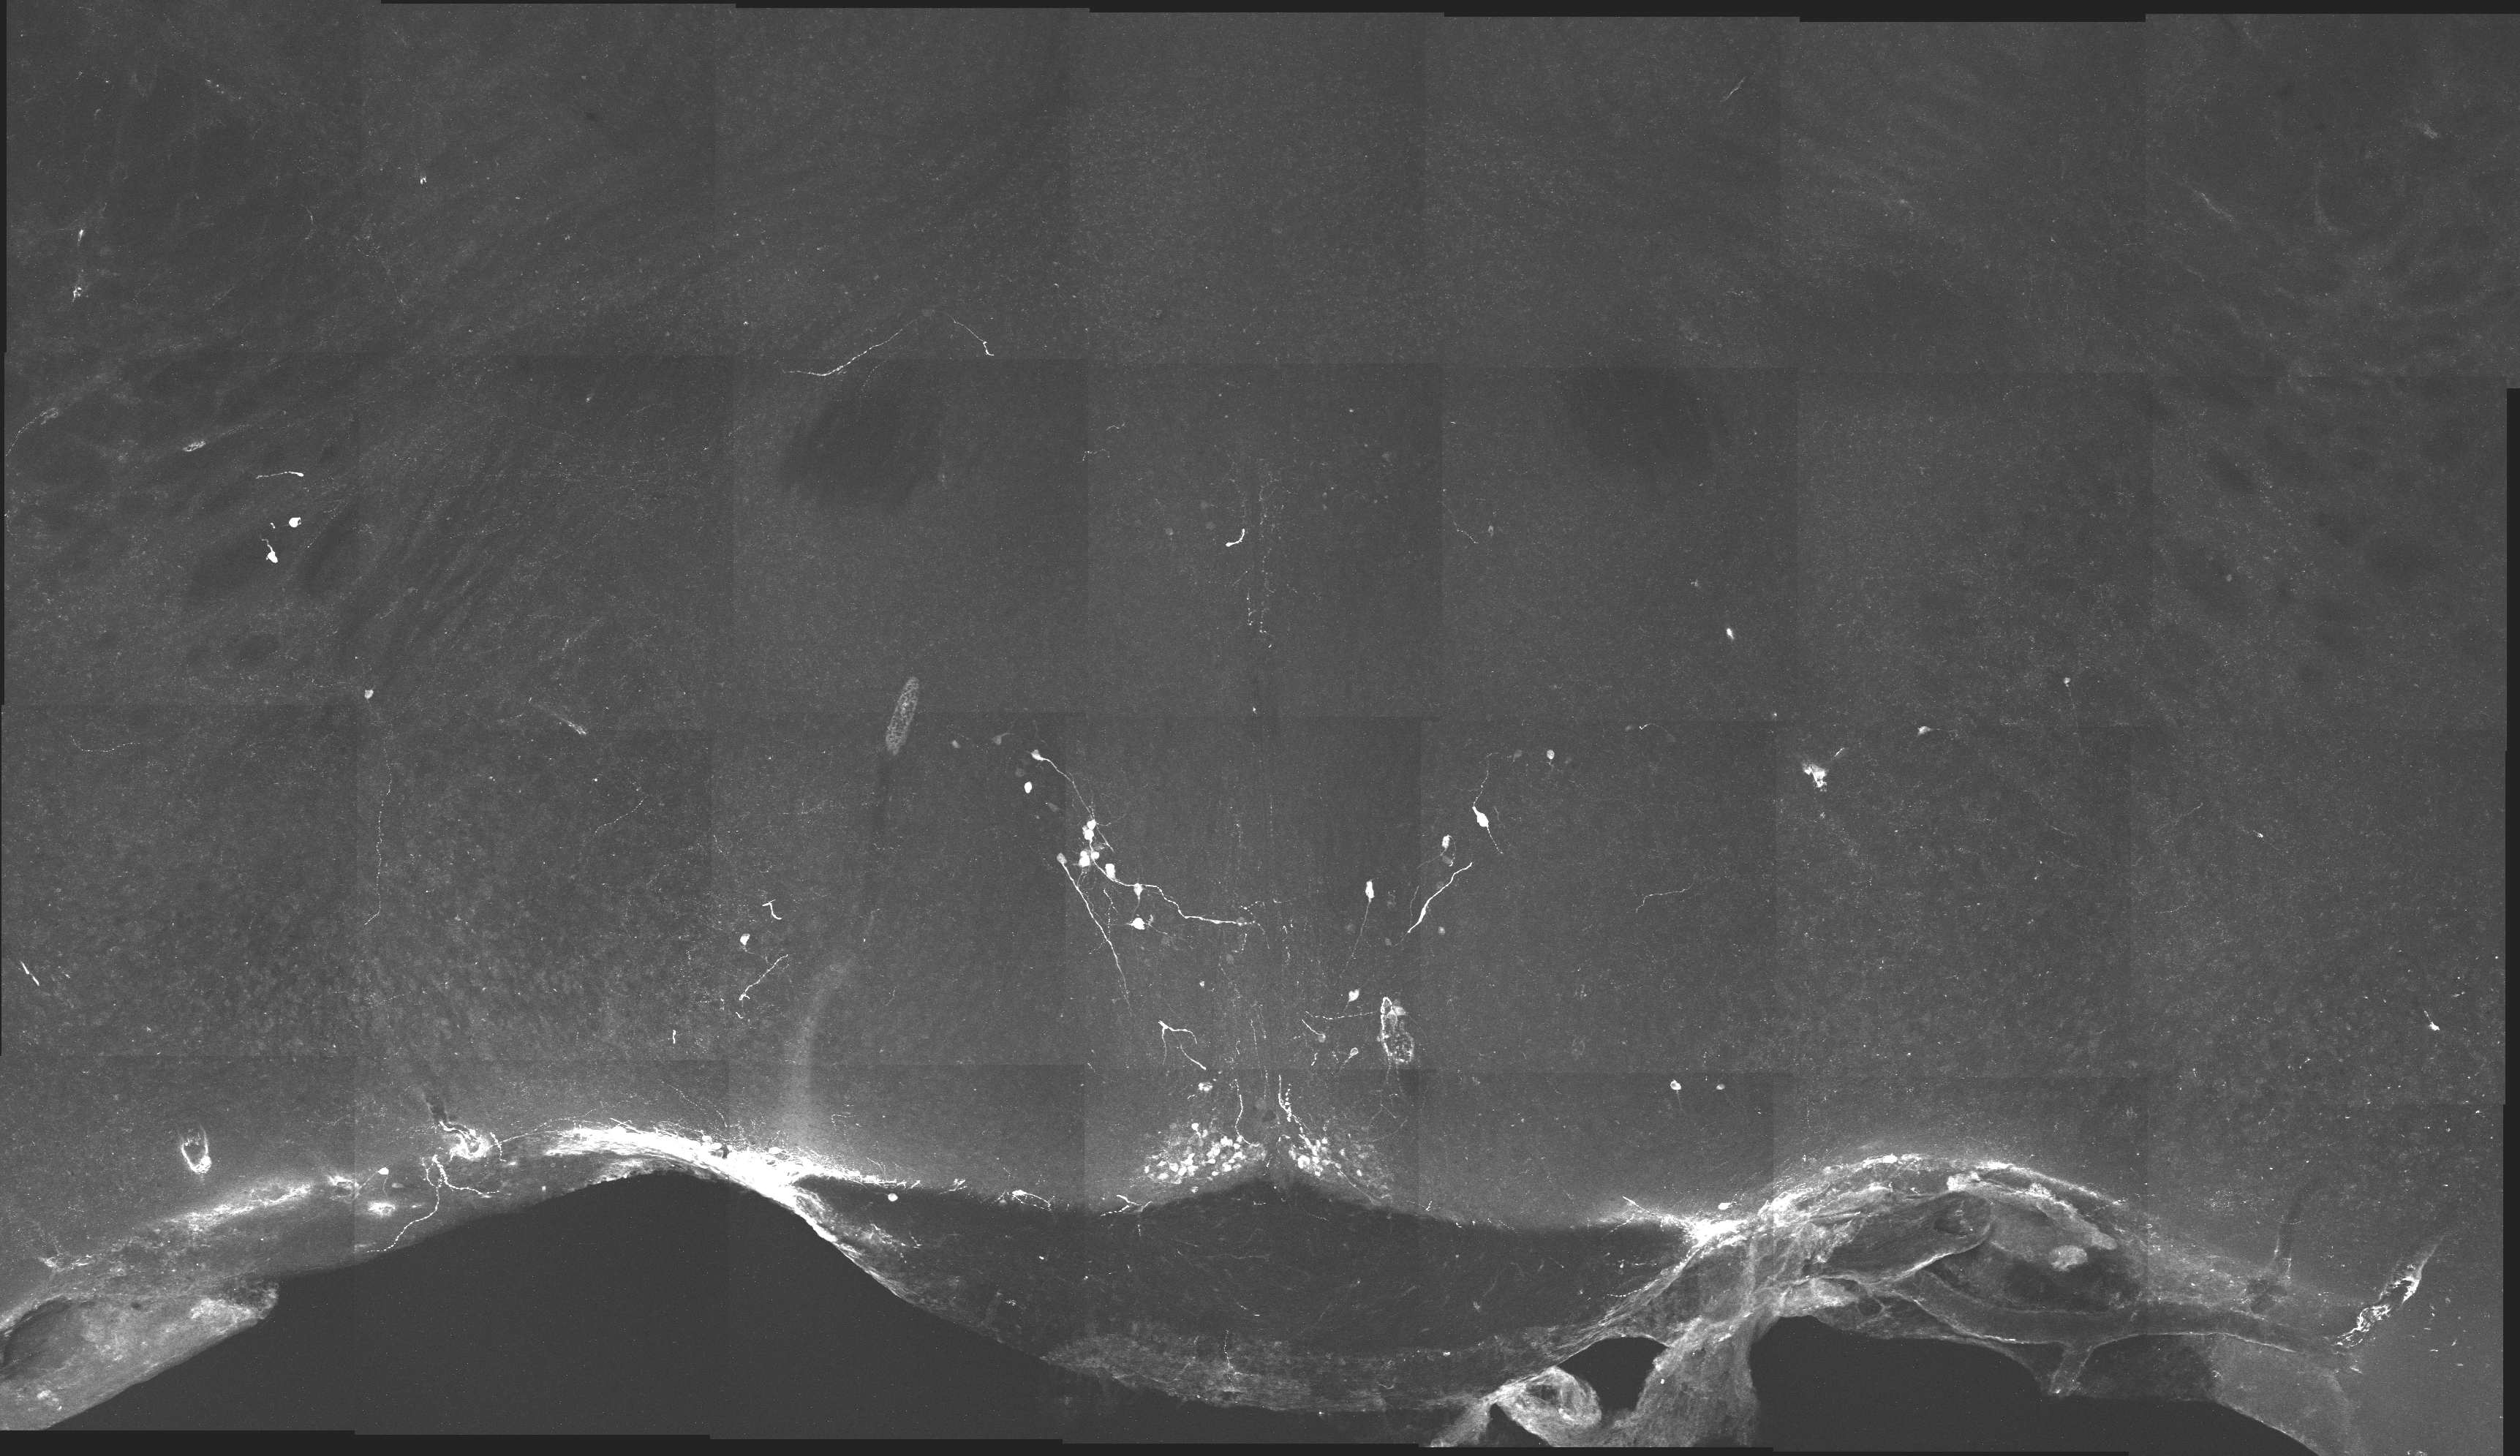
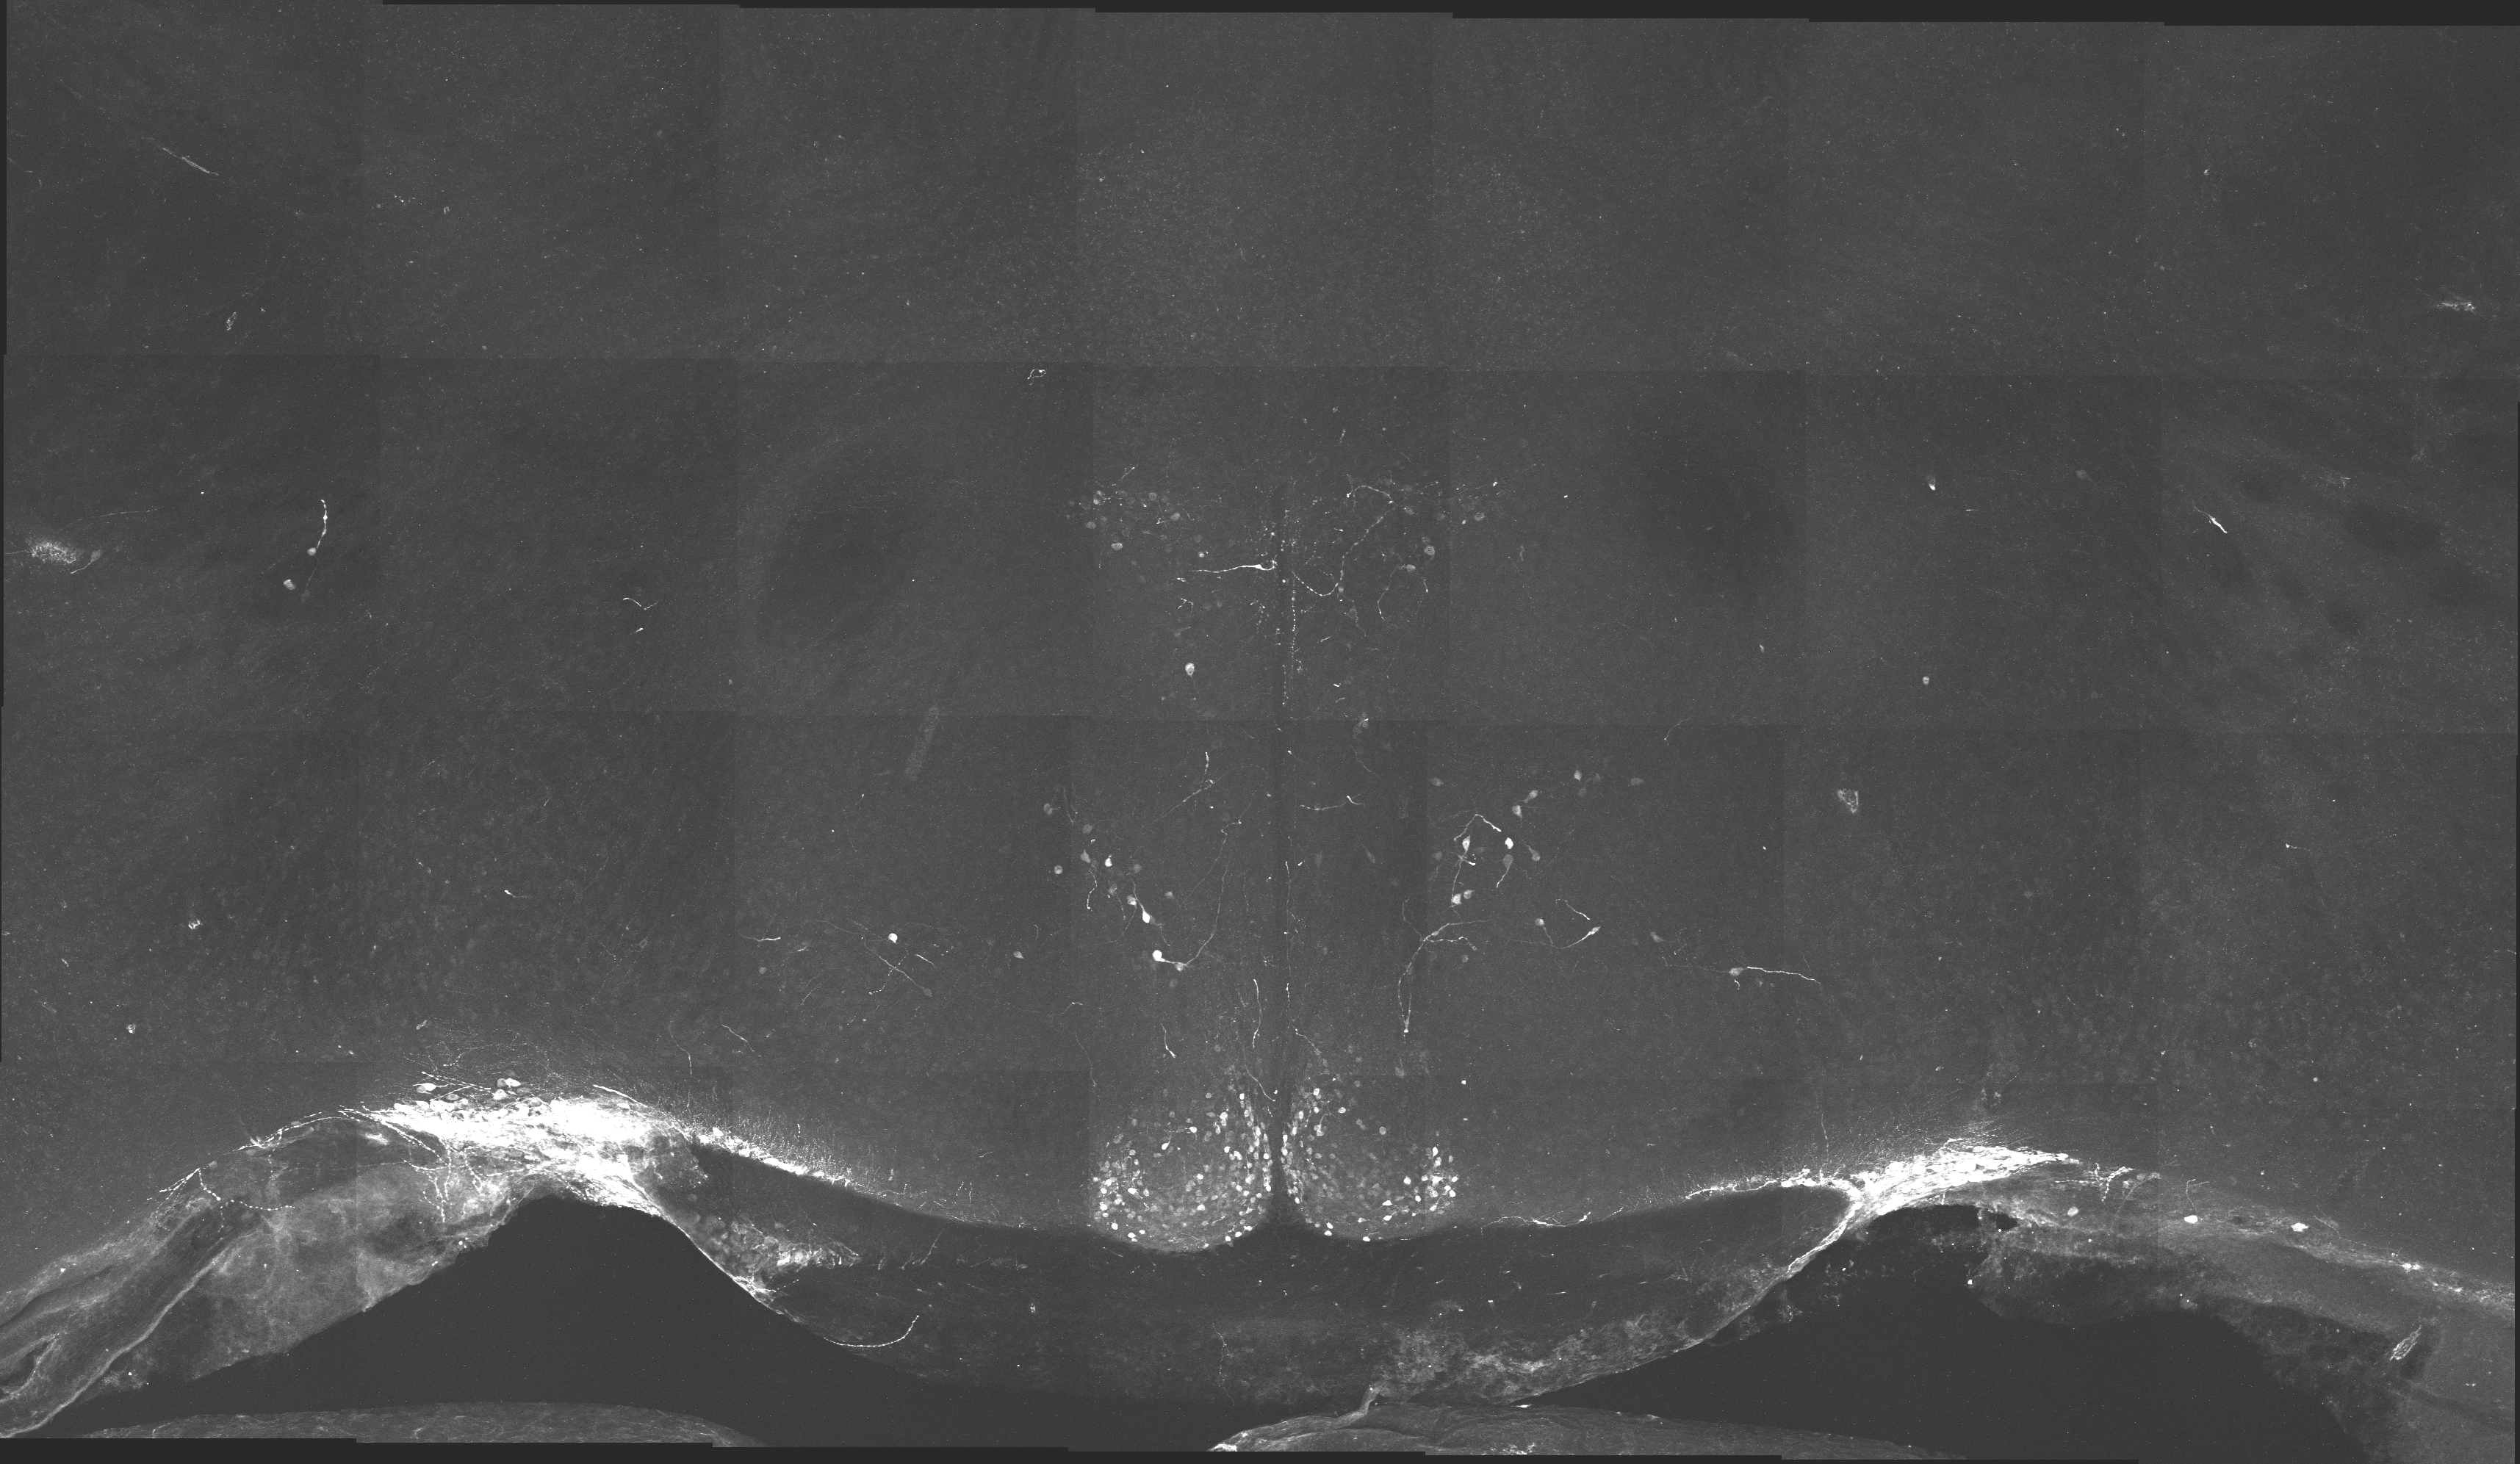
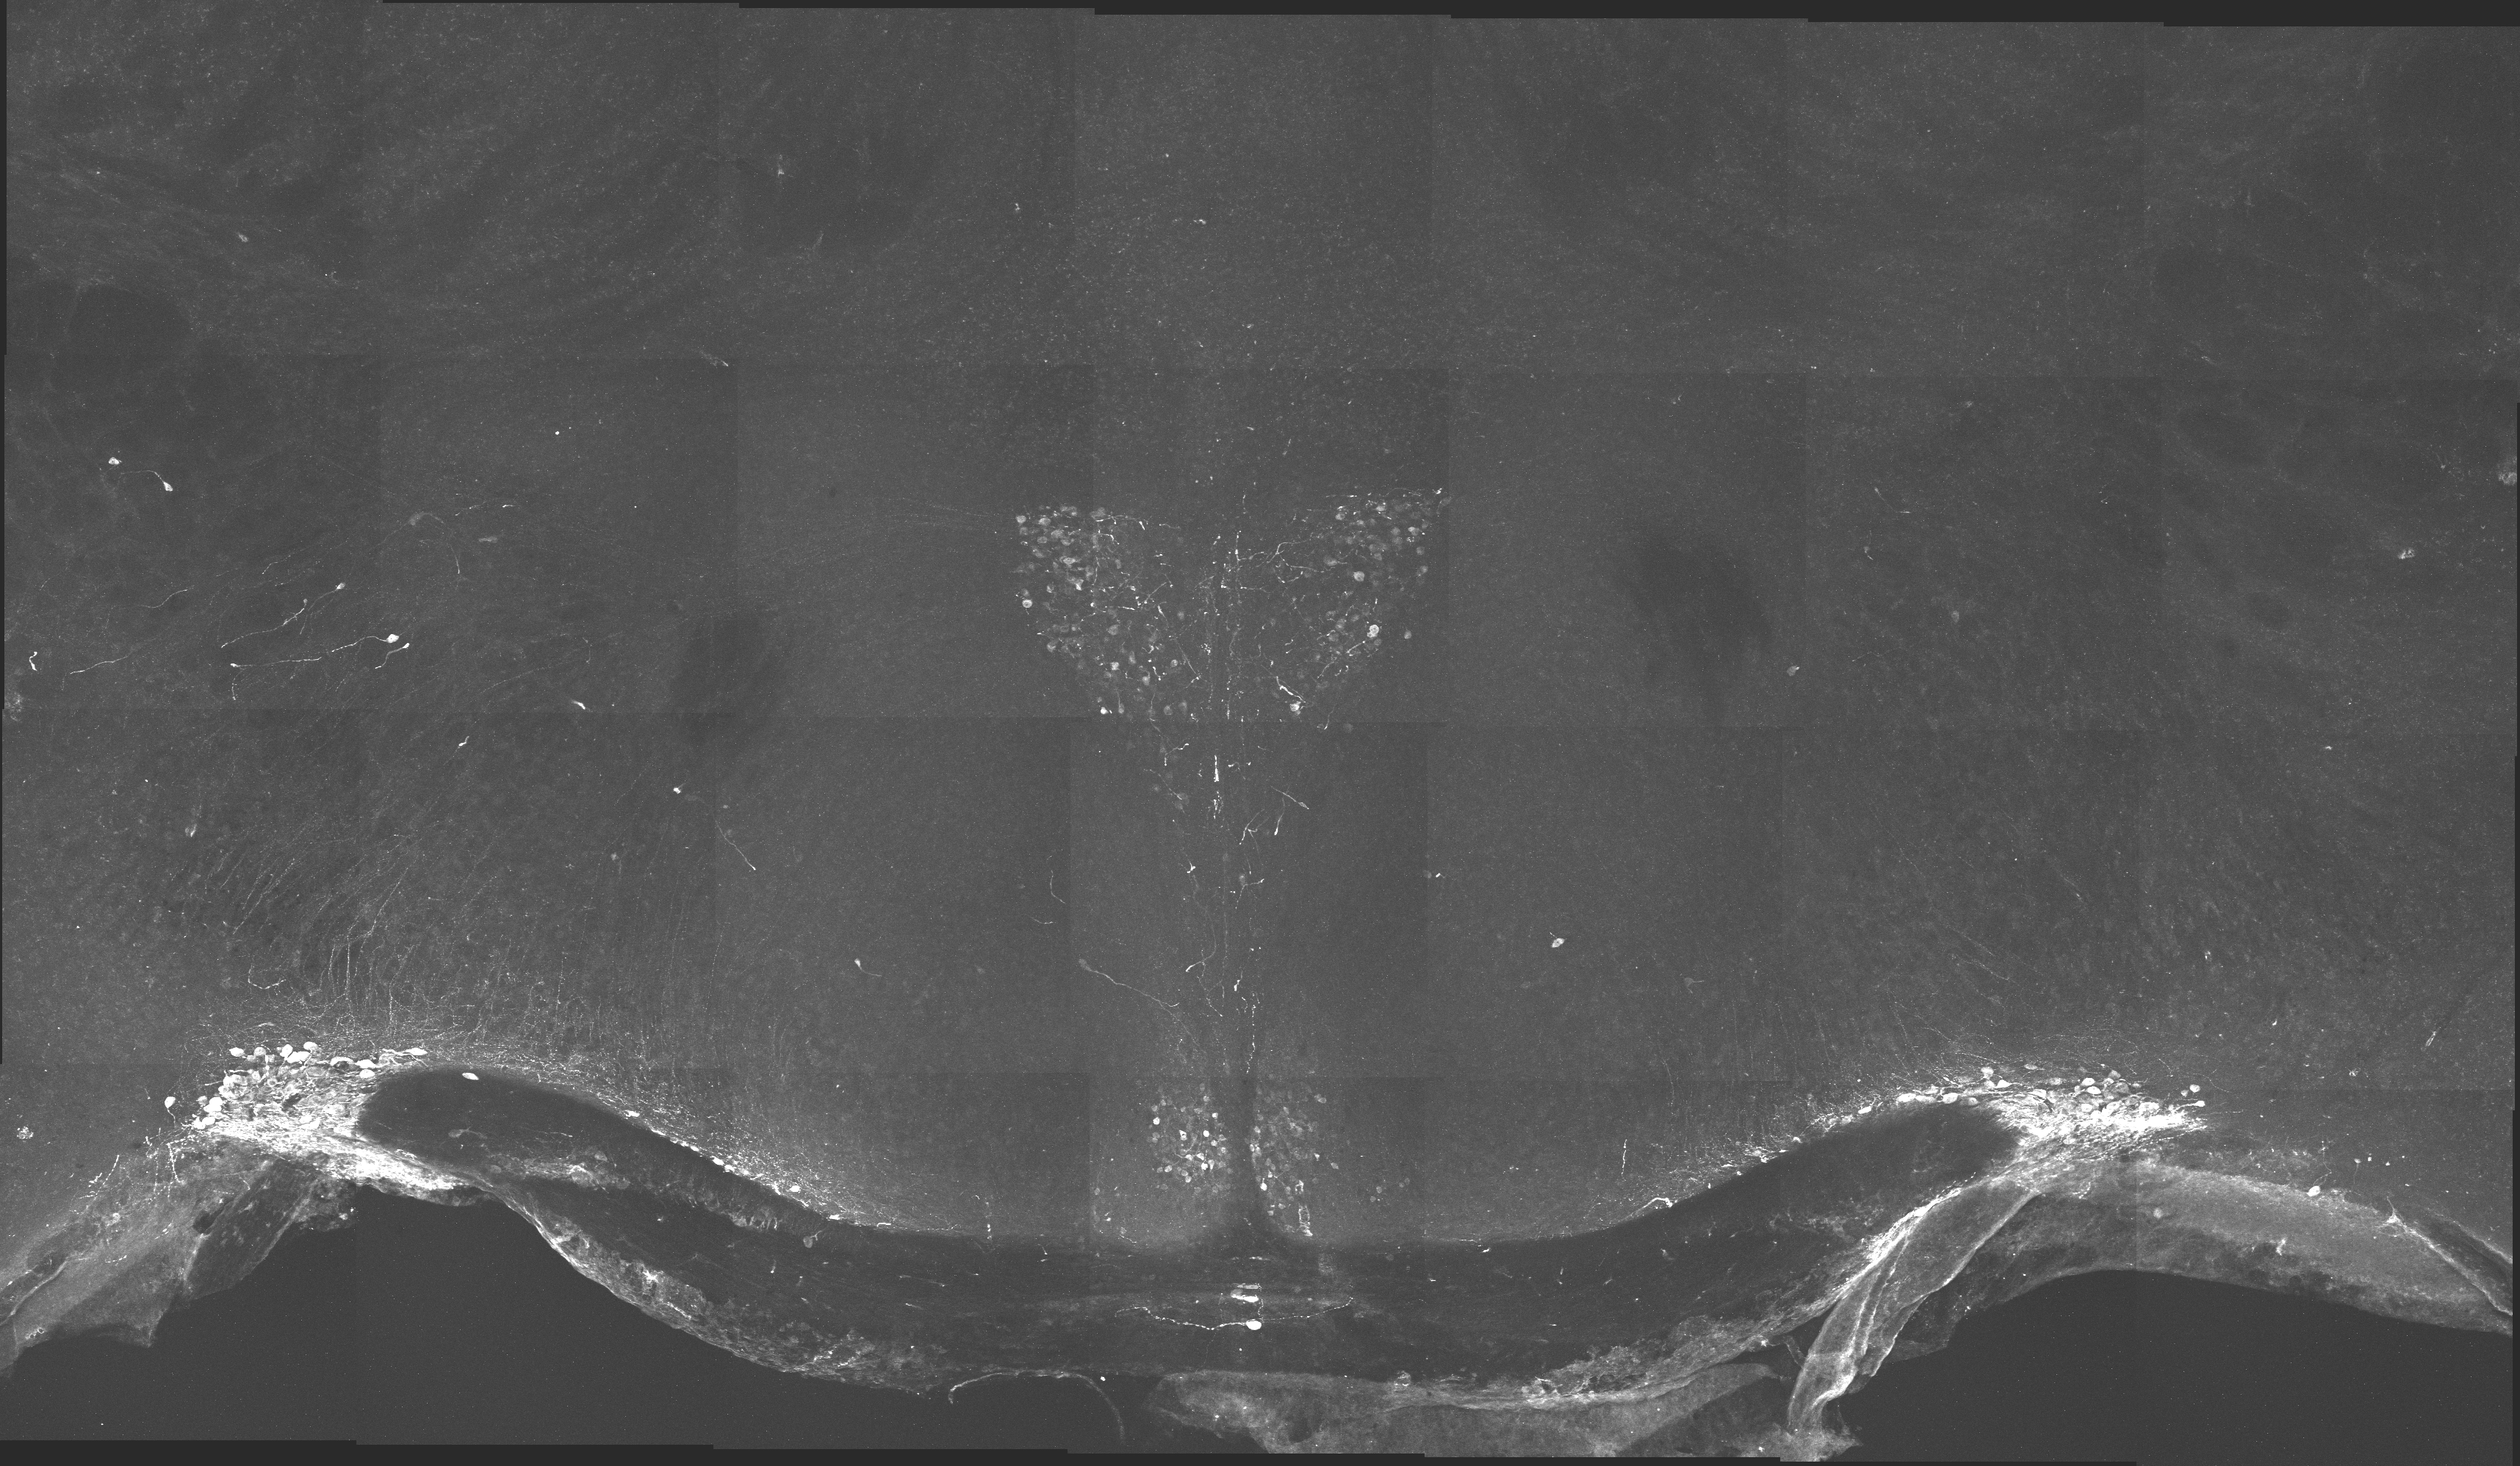
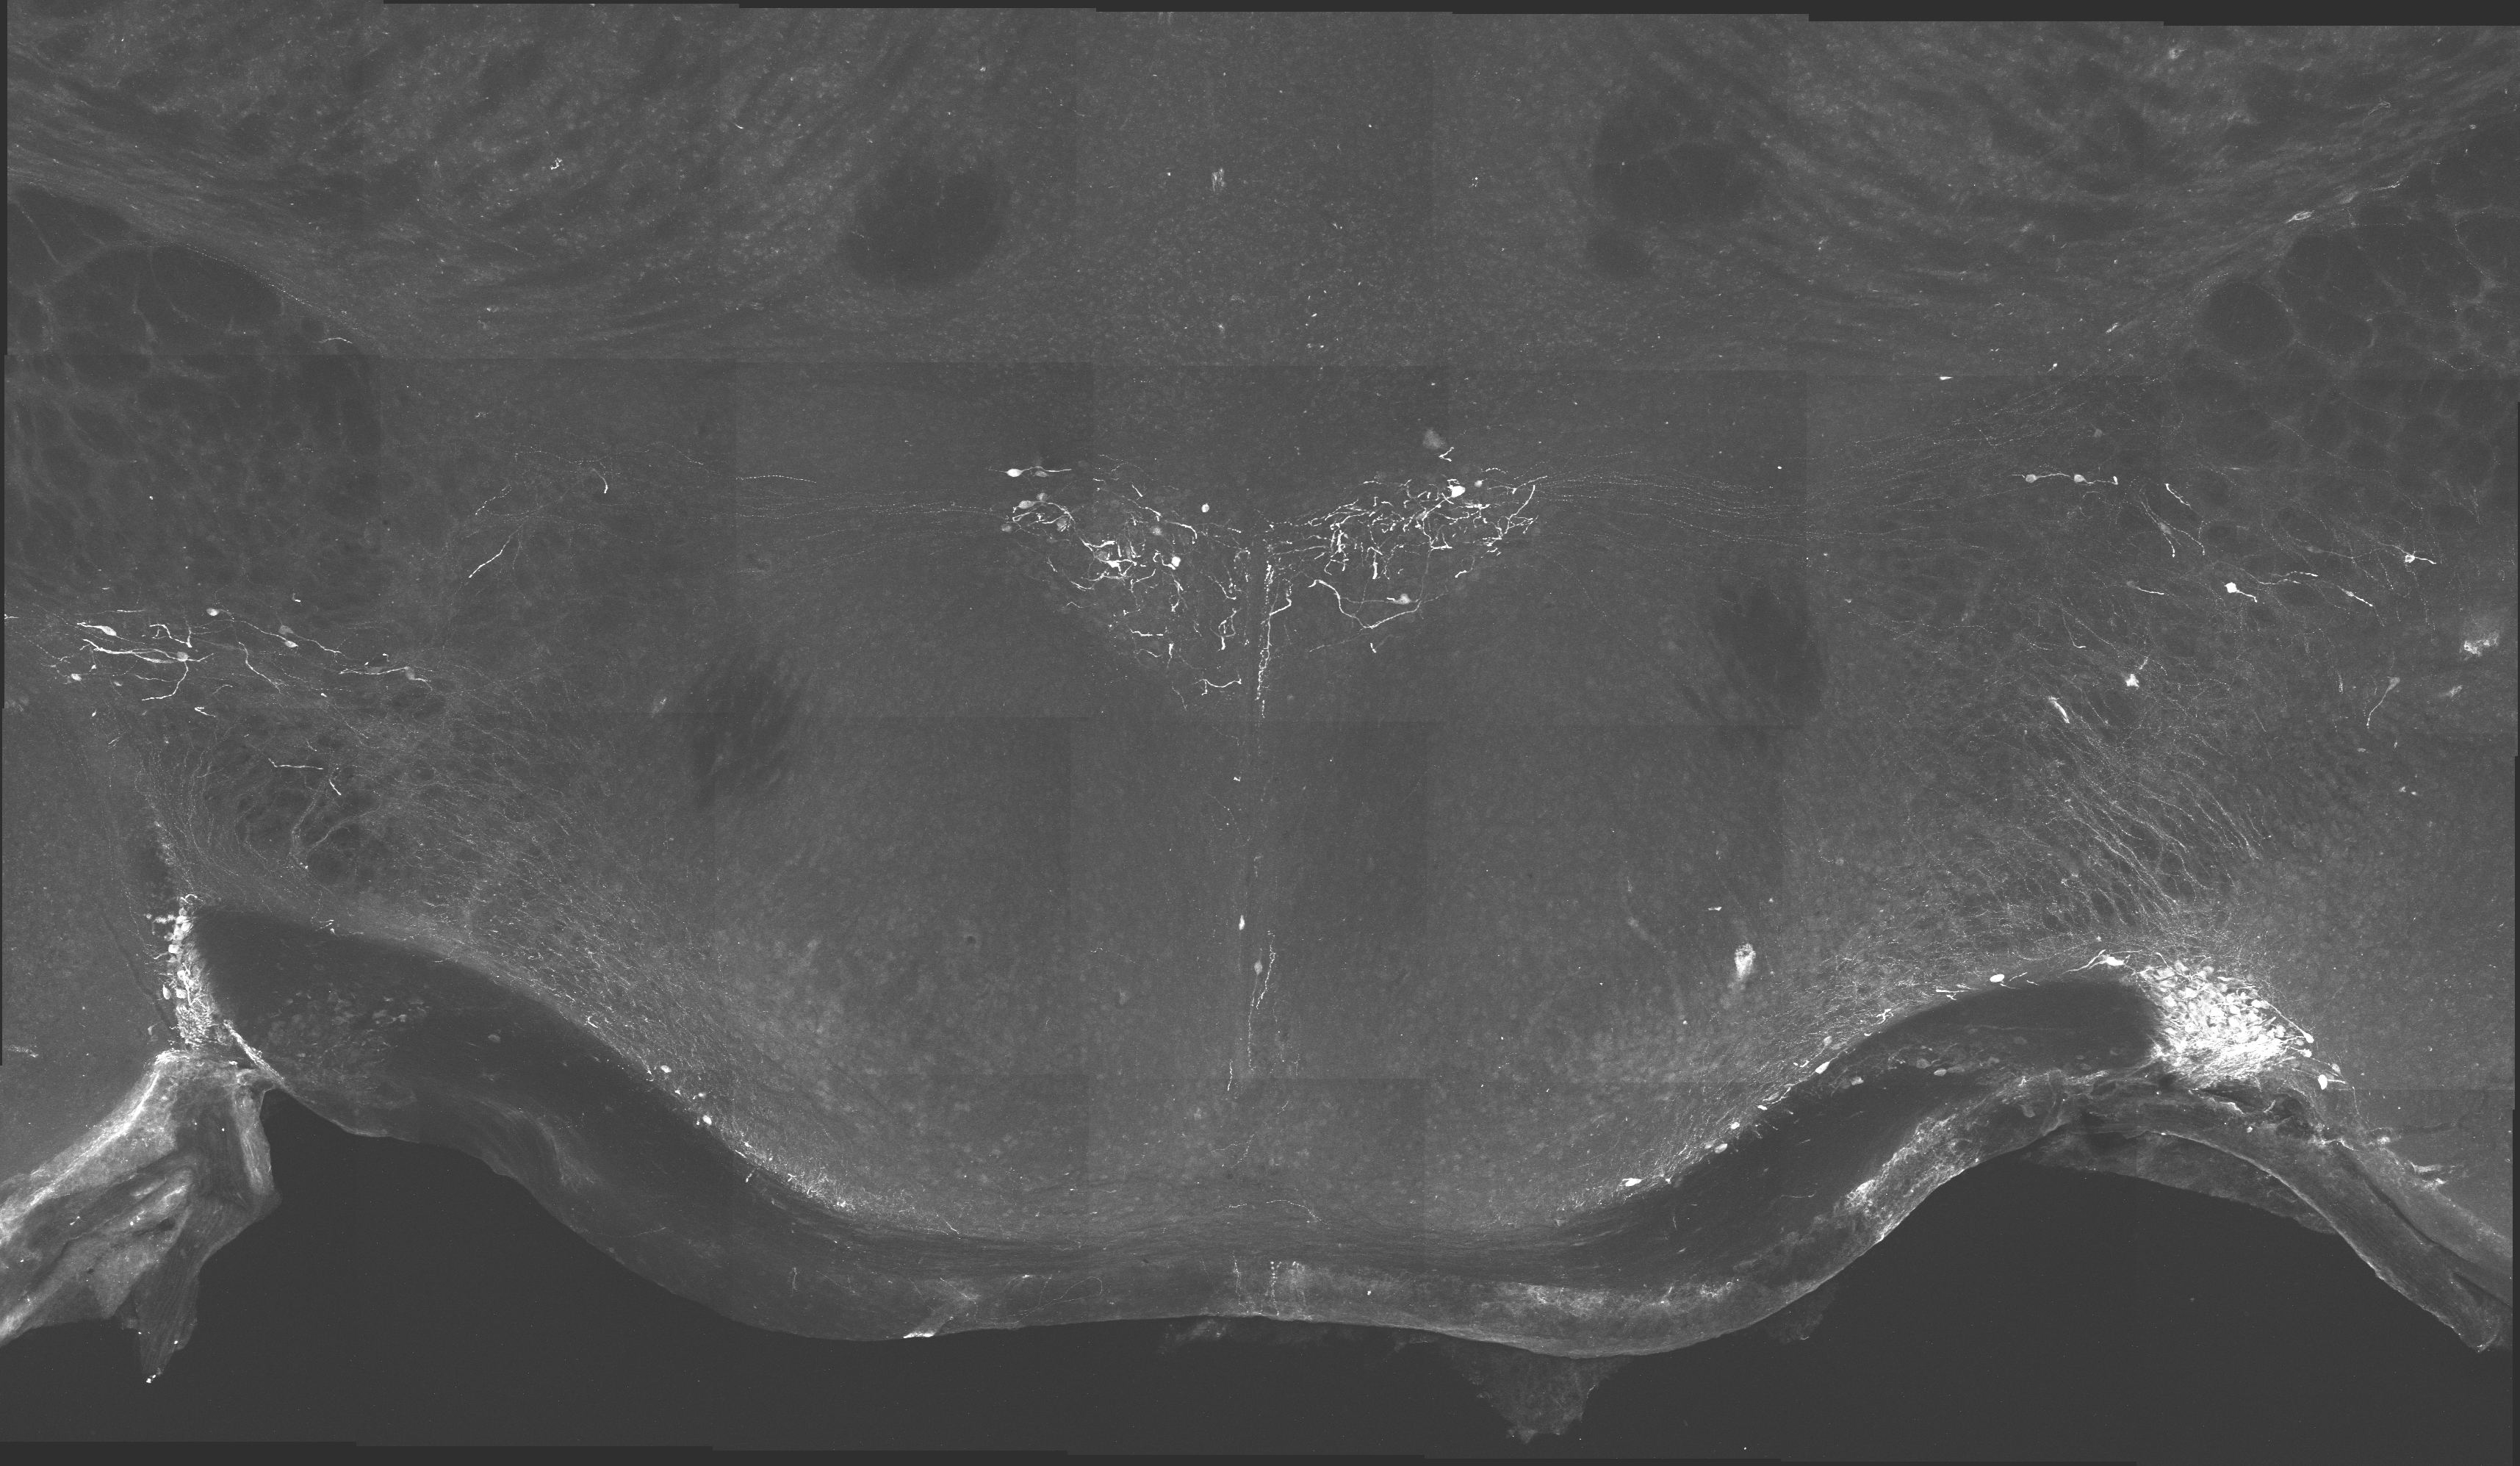
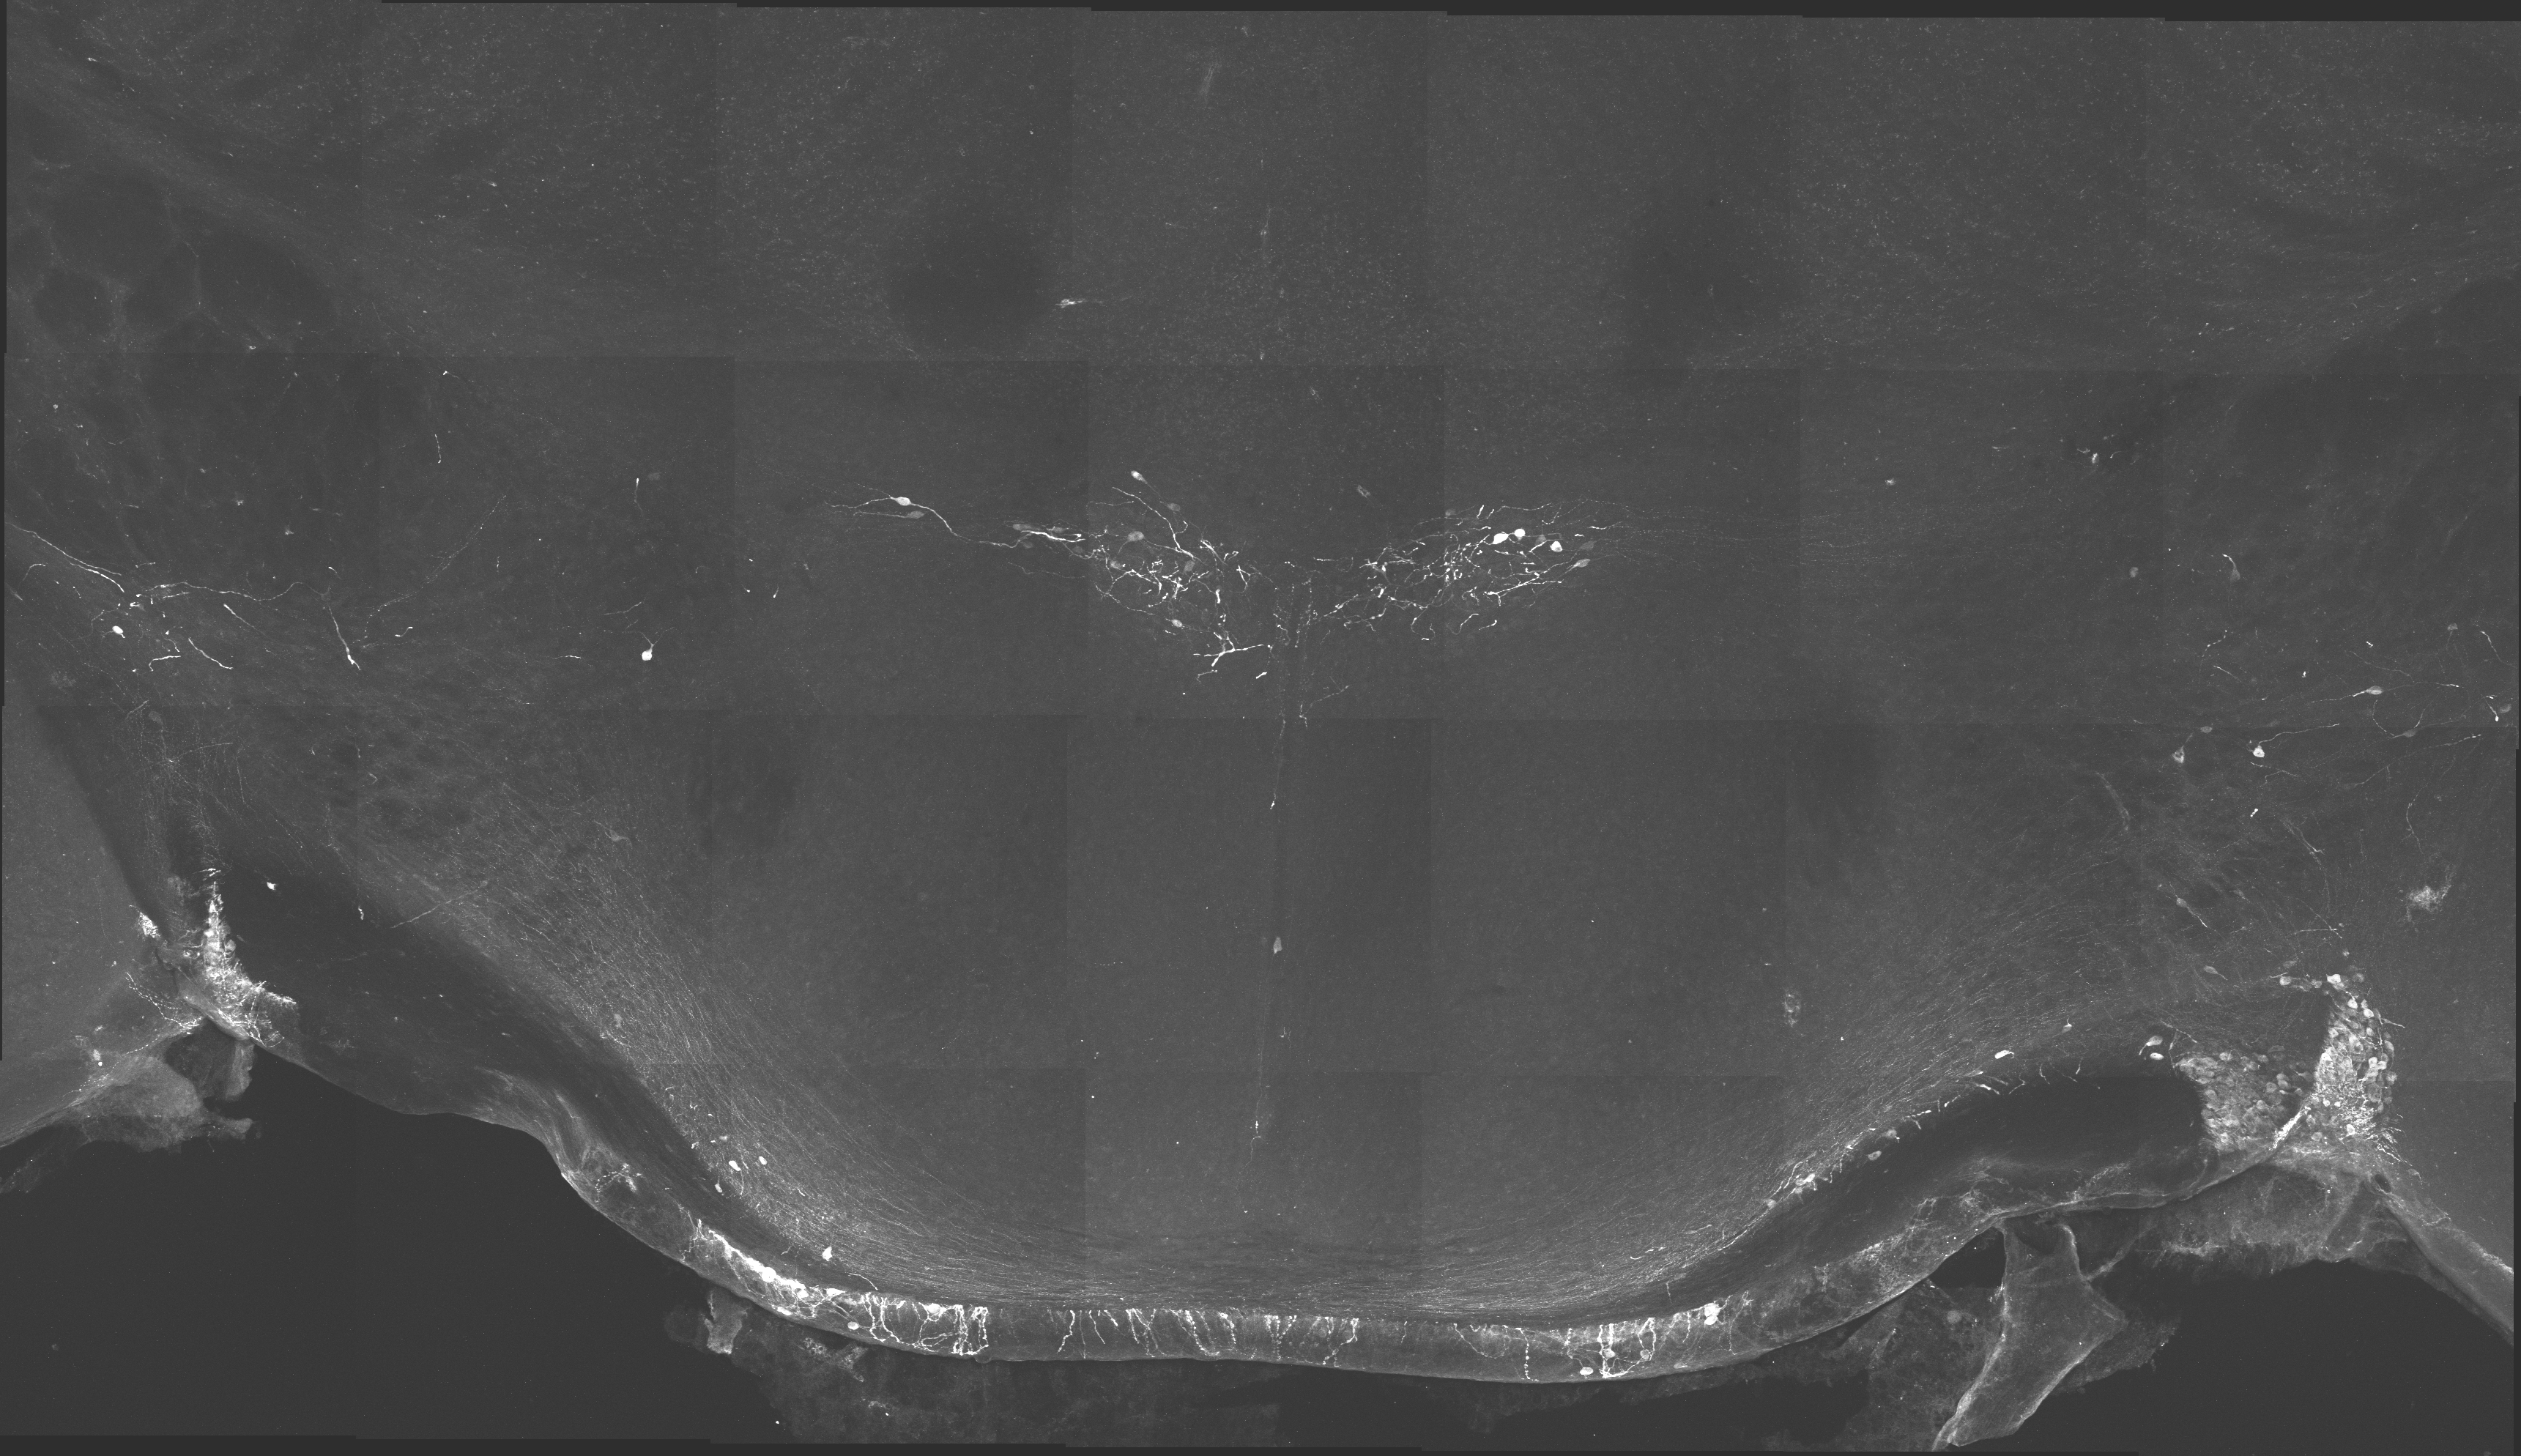
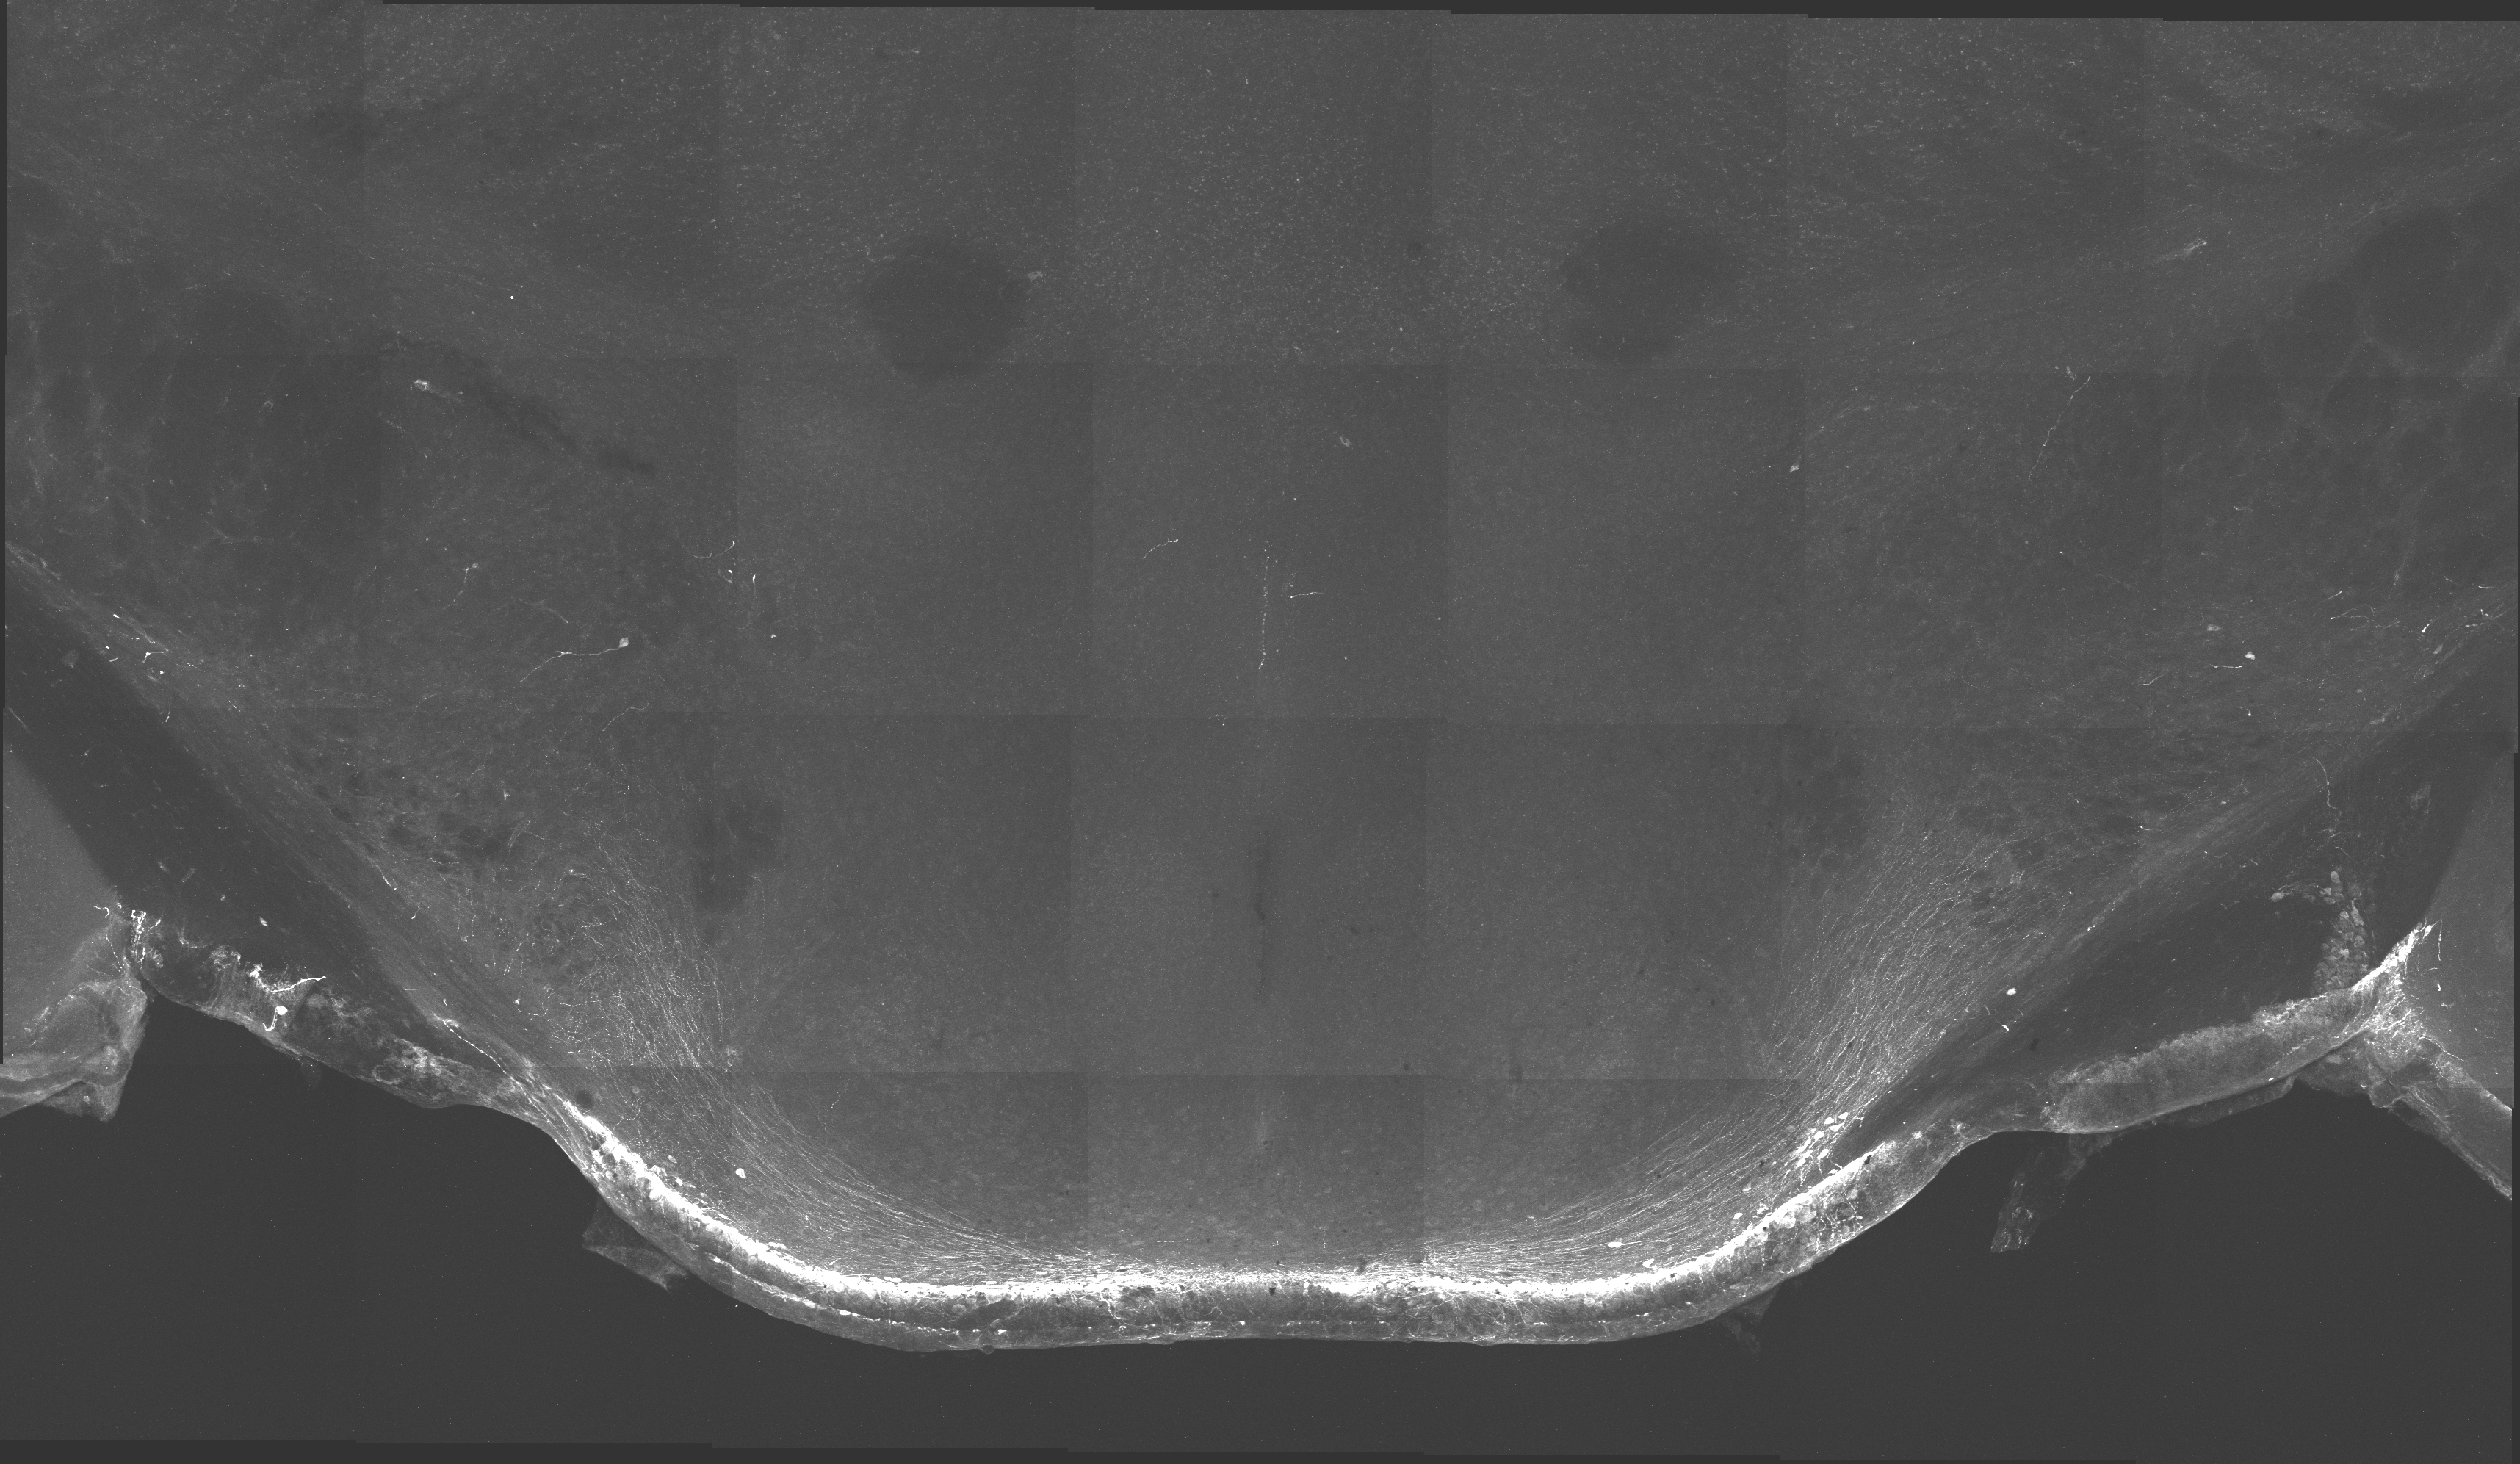
Below are the tiled individual tissue slices, each slice image is a composite of 28 microscopic fields.
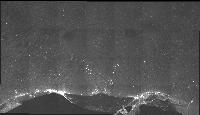
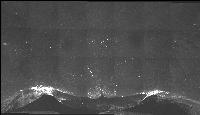

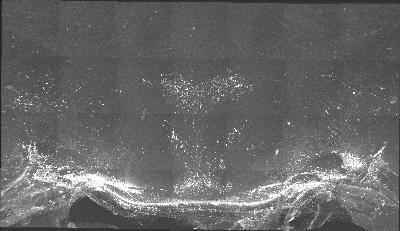
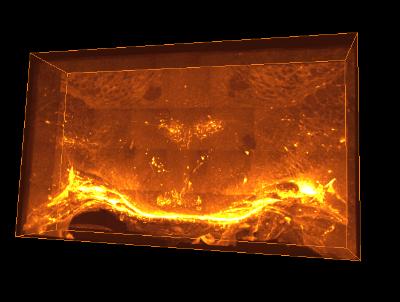
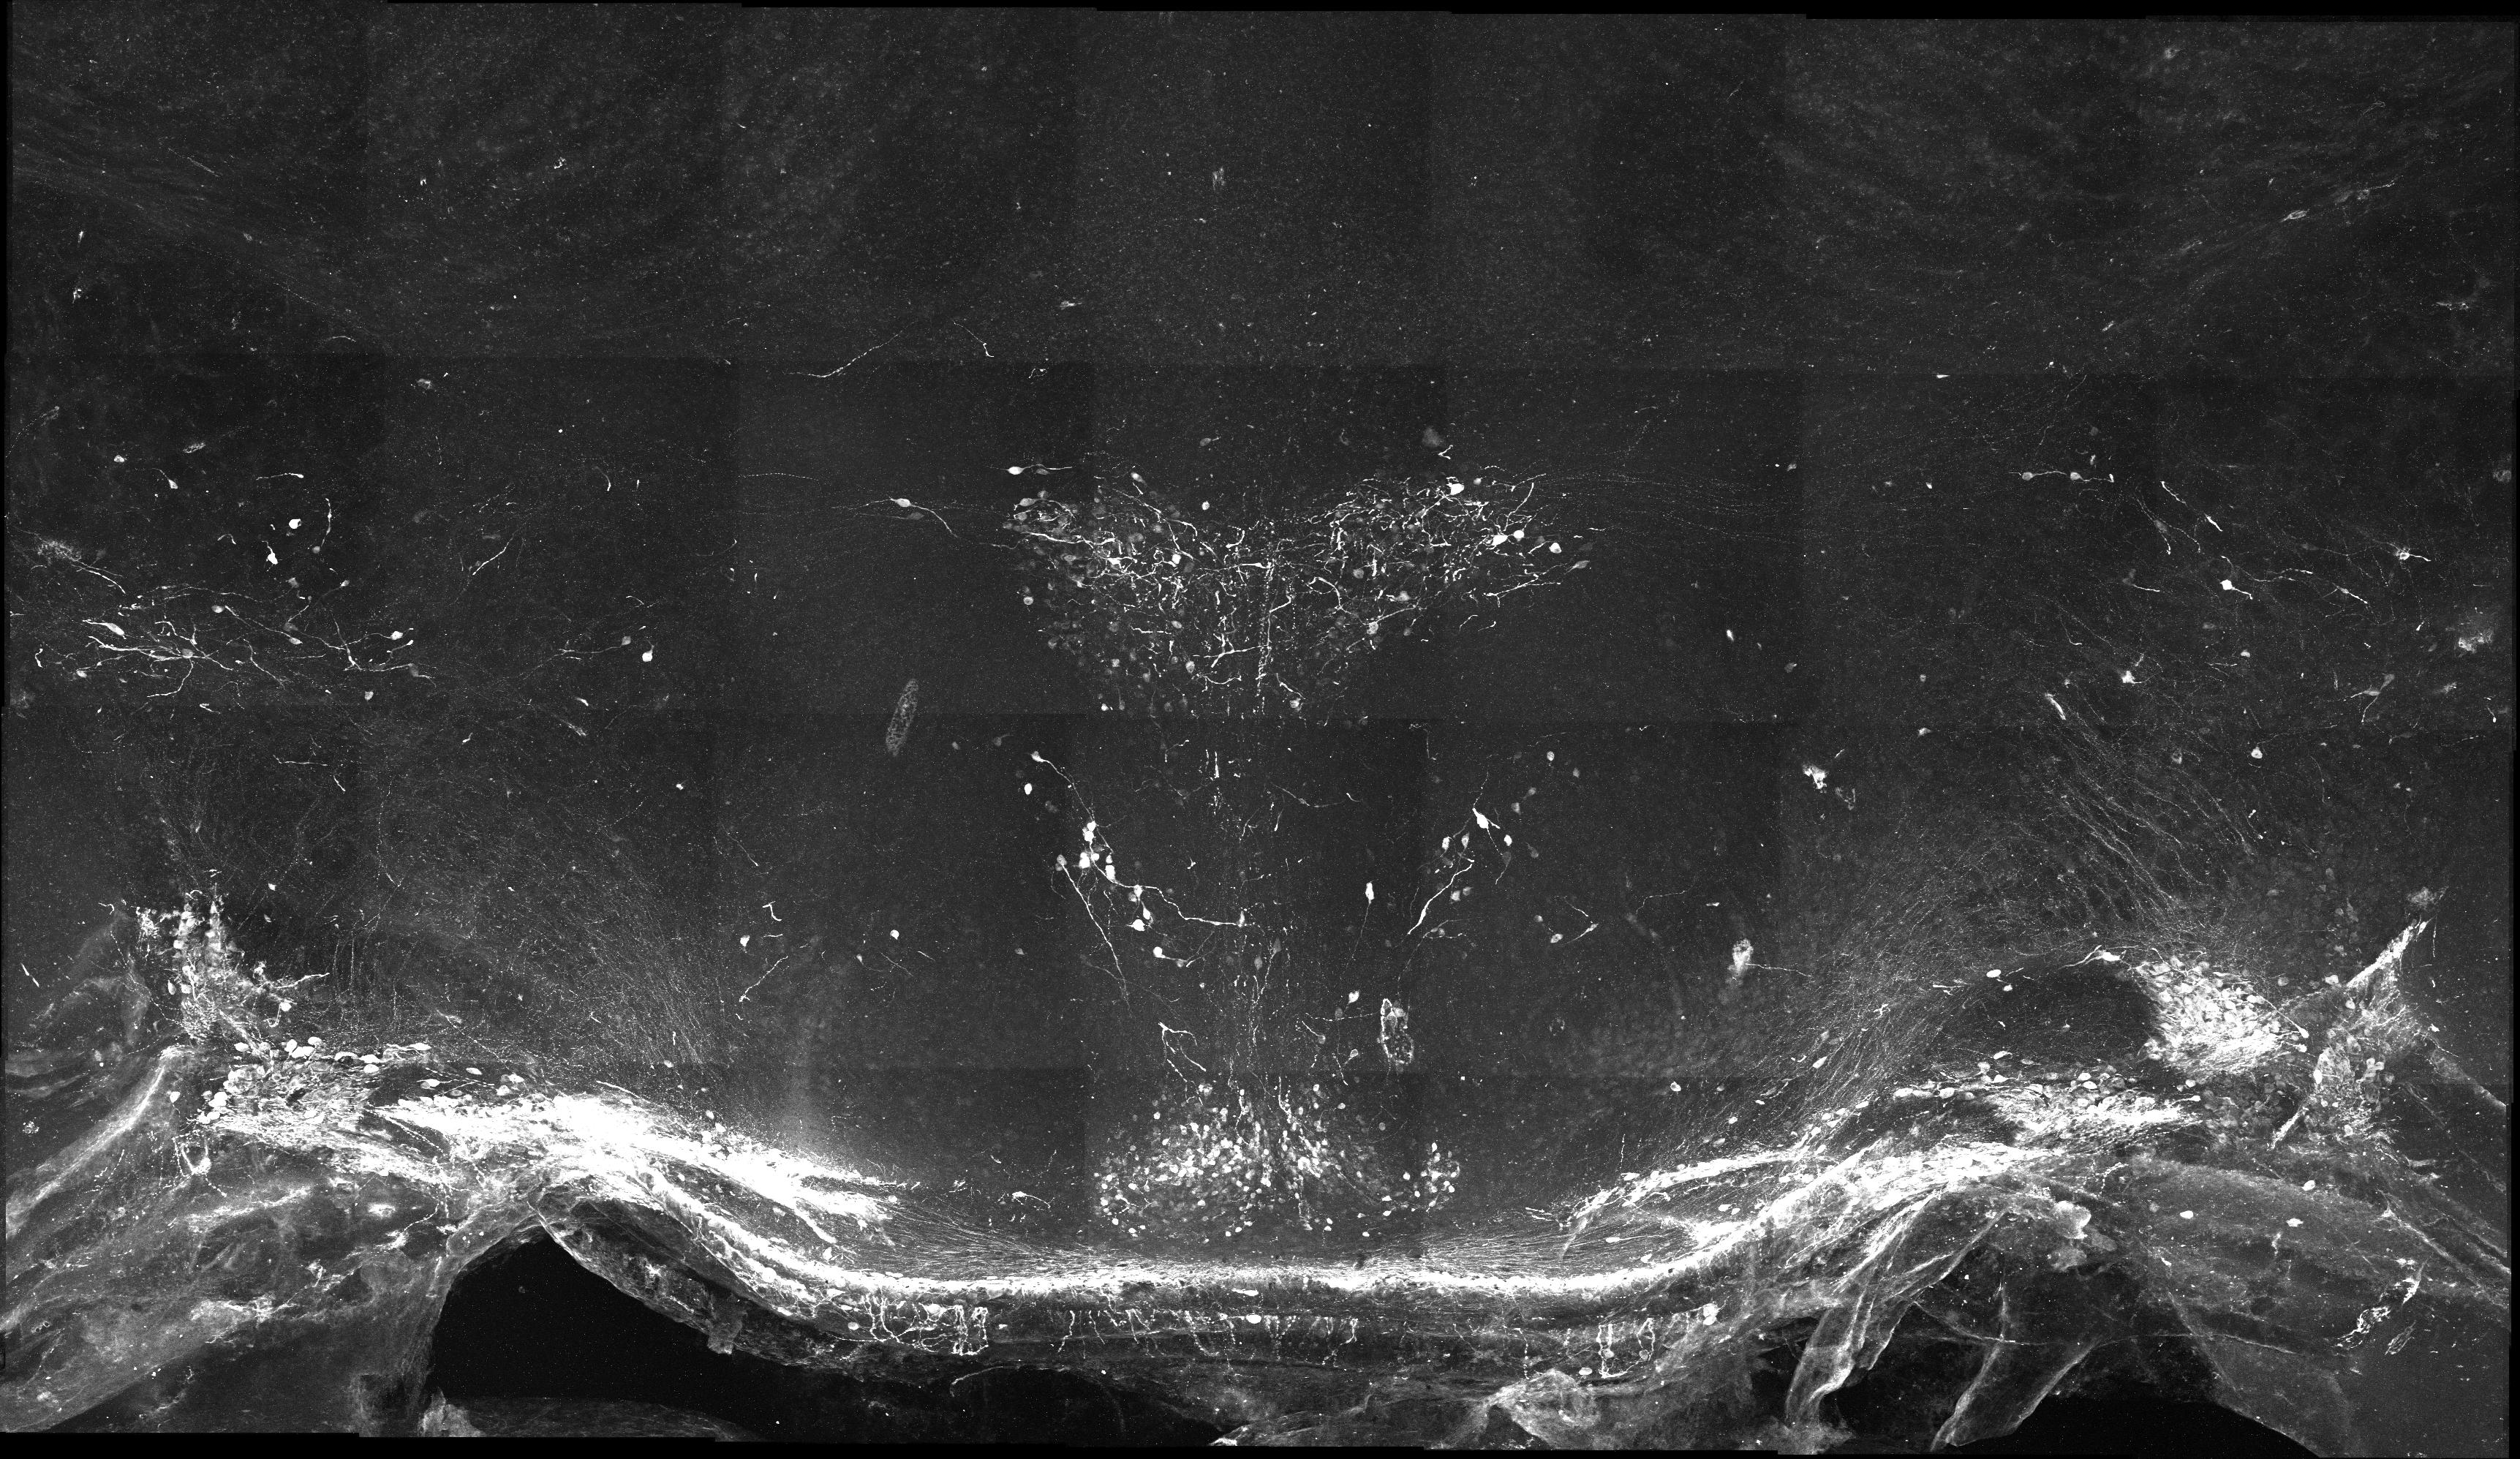
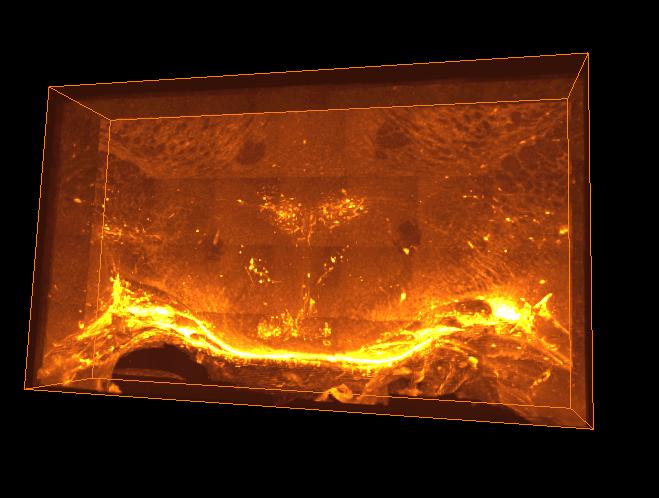
The following images are representative of the entire dataset. The first is a z-projected image of all 7 physical, aligned and recombined. The second image is of the dataset volumerendered in our 3D rendering system with a bounding box around the dataset. The data is a composite of 19600 optical sections/images :
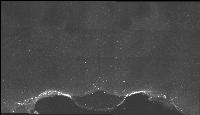
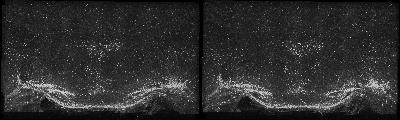
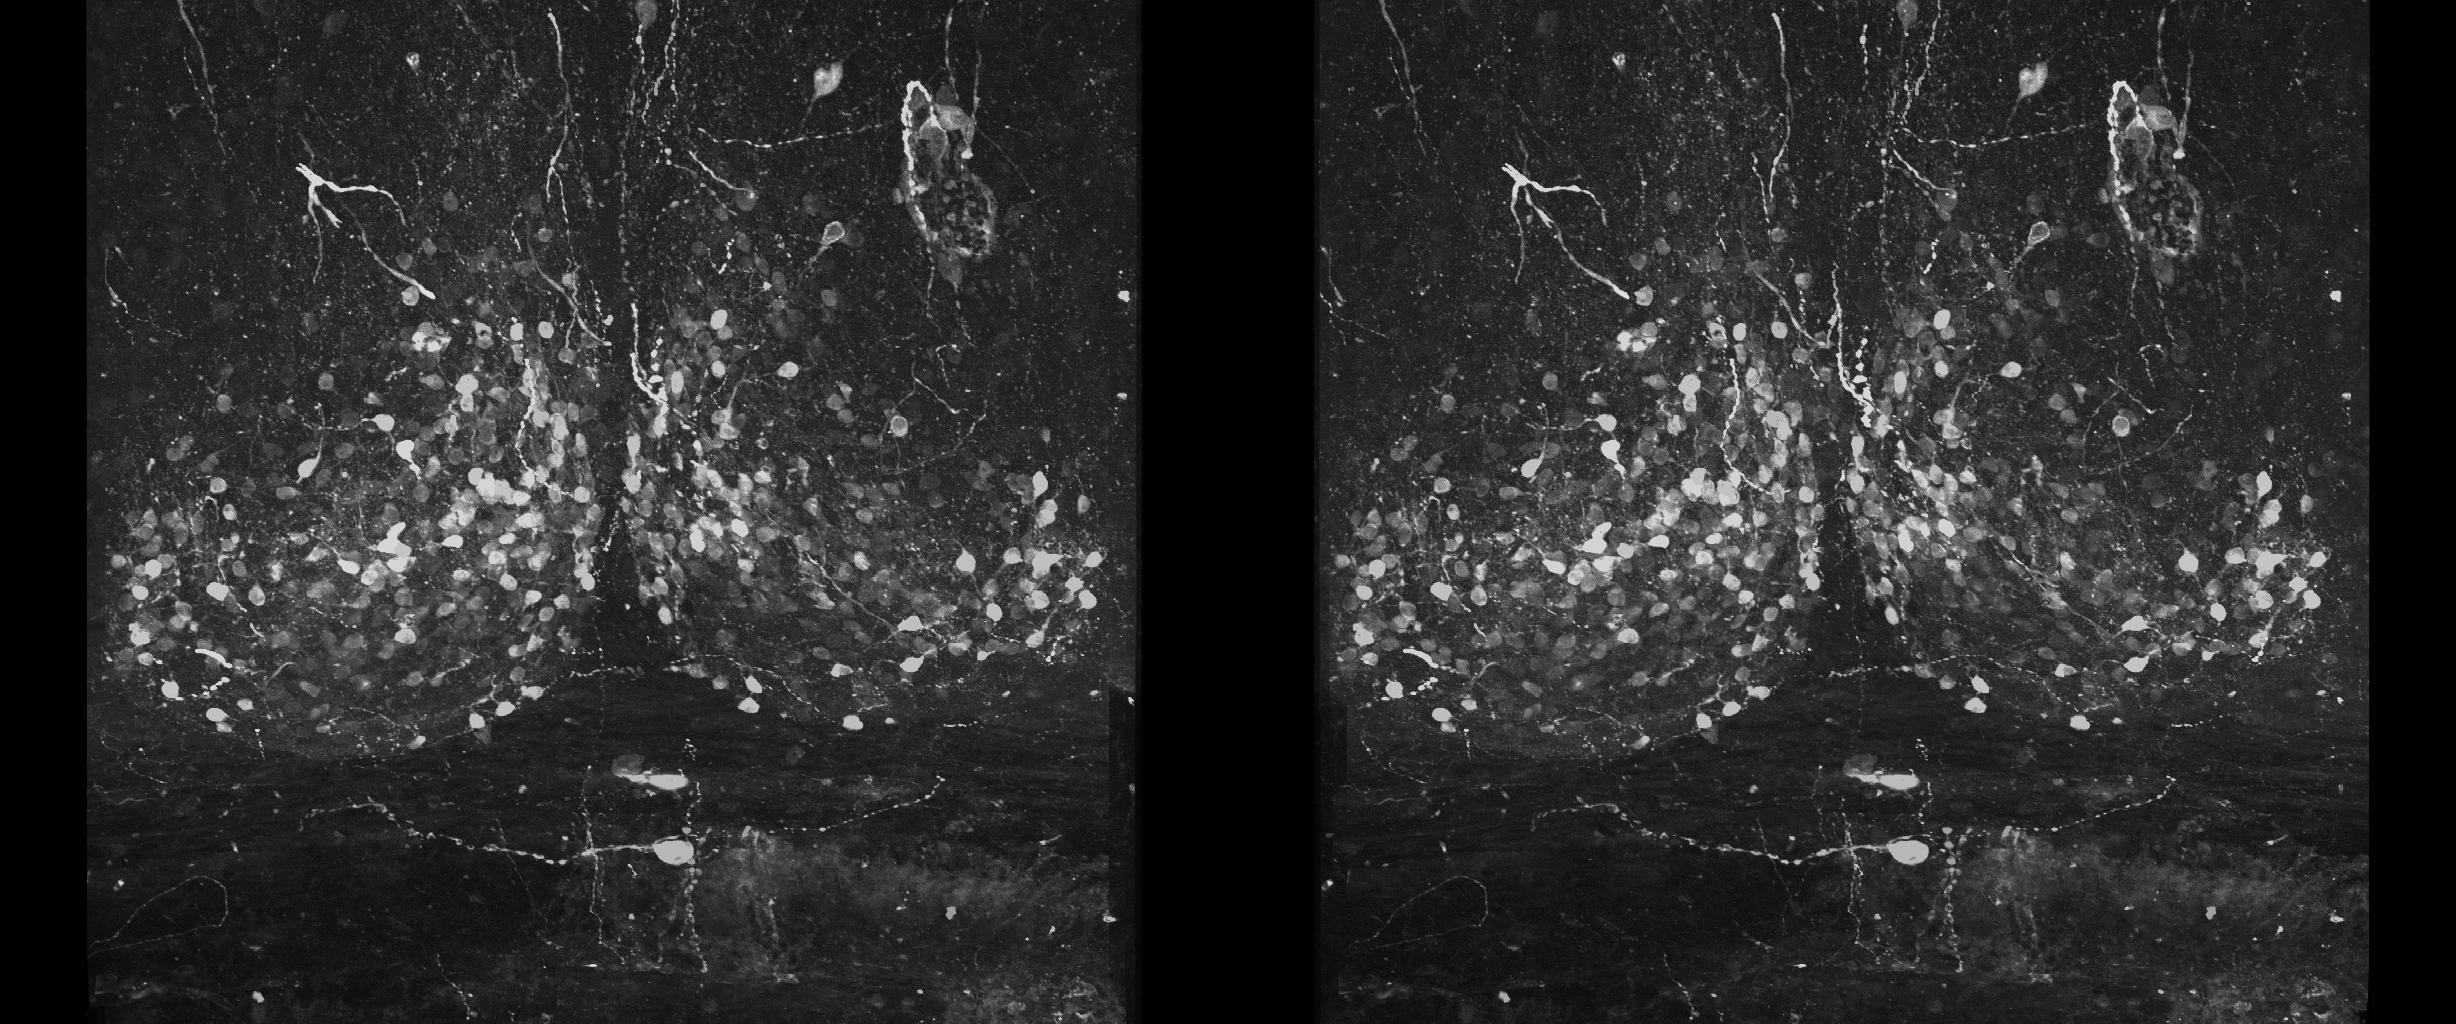
The following is a stereoscopic image of the suprachiasmatic nuclei (SCN) it can be viewed in 3D by using the crosseyed method.
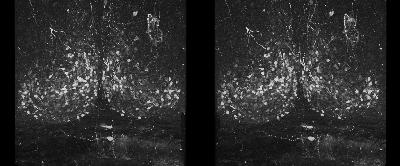
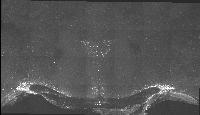
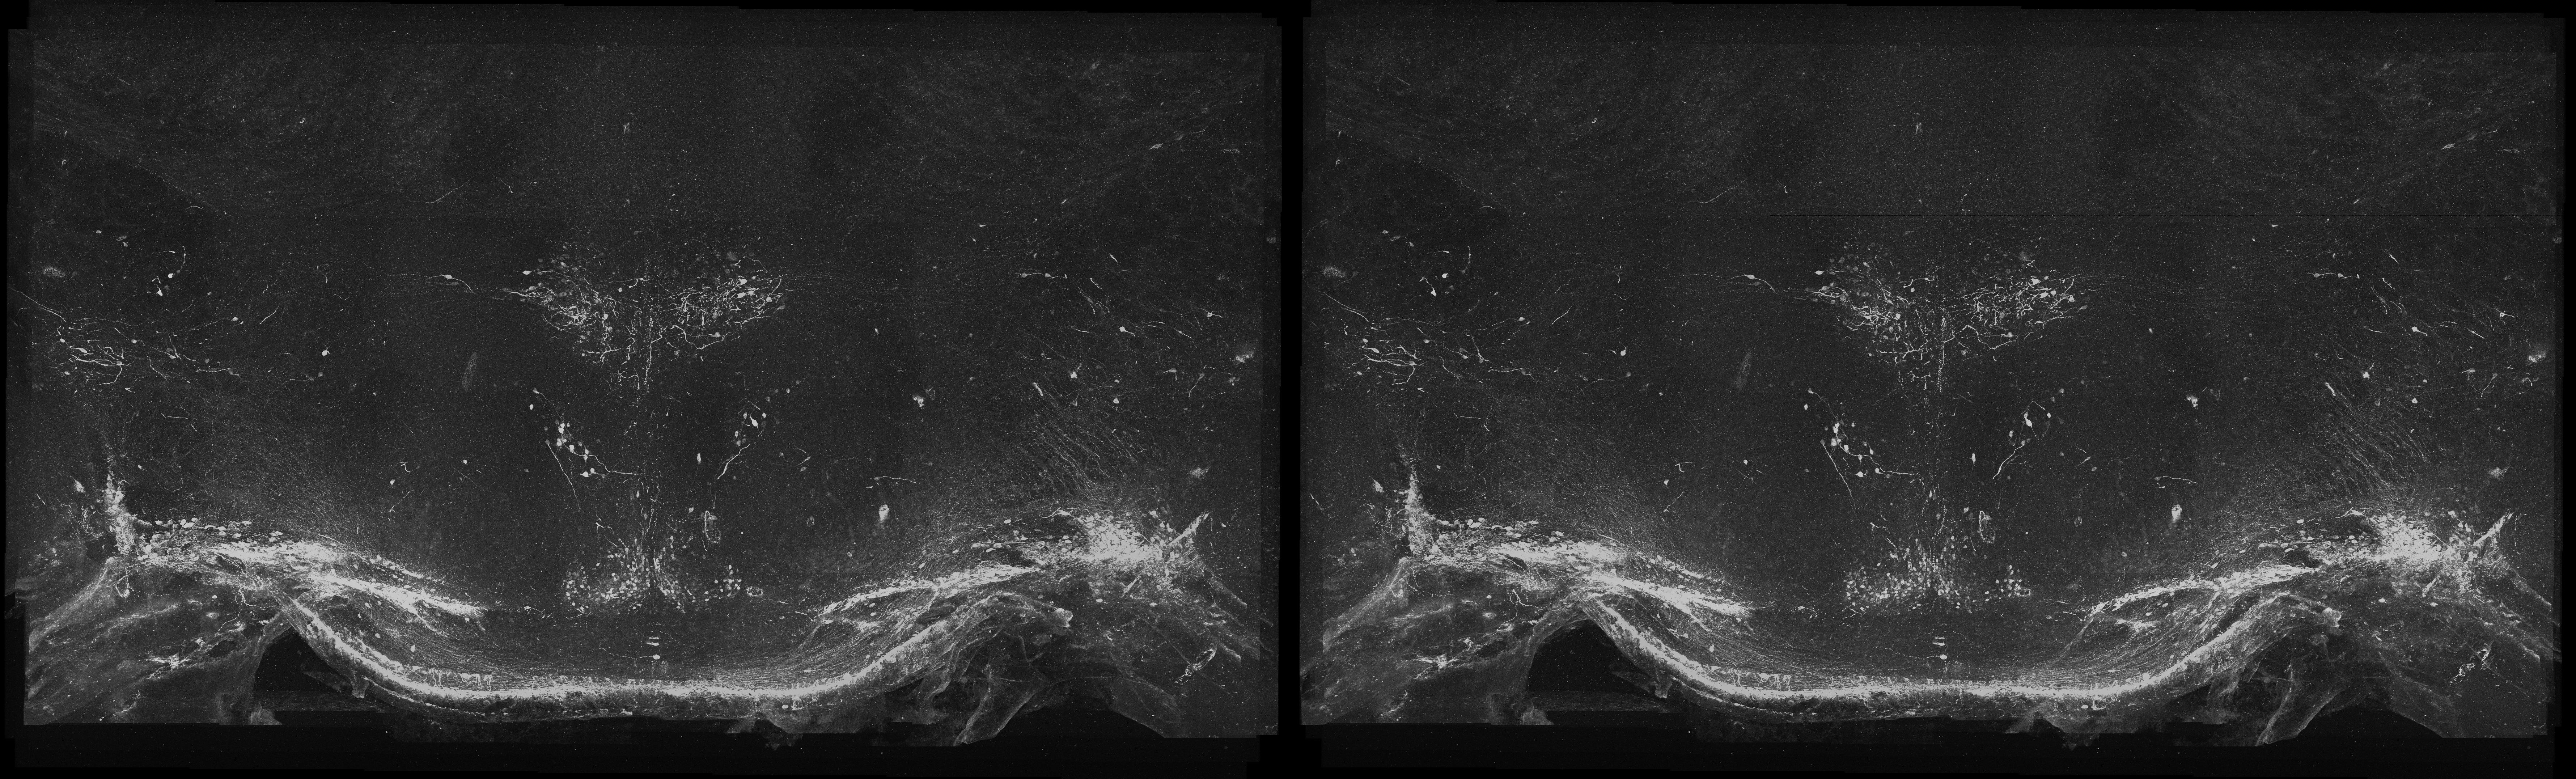
The following is a stereoscopic side-by-side image of the the entire dataset it can be viewed in 3D by using the crosseyed method, or using standard stereo projection techniques.
Click on the image to view an animation sequence of the dataset. To zoom in click the mouse on the image after it has loaded. Be aware that the image is high resolution(1800x2153)and is 143 MB so will take a while to download on slow connections. An even larger version is provided on the link below.
This is a link to the bigger version of the animation sequence (3560x2153) 554 MB
The follwoing is a link to an interactive image that permits zooming, rotating and navigating a sequence of the data based on a 3D viewer,
3DNP, created by Thorsten Schluter. Click
HERE, to access the image.

